Do you have a lot of flows and want more tools to manage them?
Good news, you can easily monitor your Power Automate endpoints (triggers and actions used by your connectors) via the Power Automate Endpoint Dashboard.
How you get there
- Go to Events > Settings > Integrations OR Tickets > Settings > Integrations
- Scroll down the page until you get to the Power Automate Endpoint Dashboard
How the dashboard works
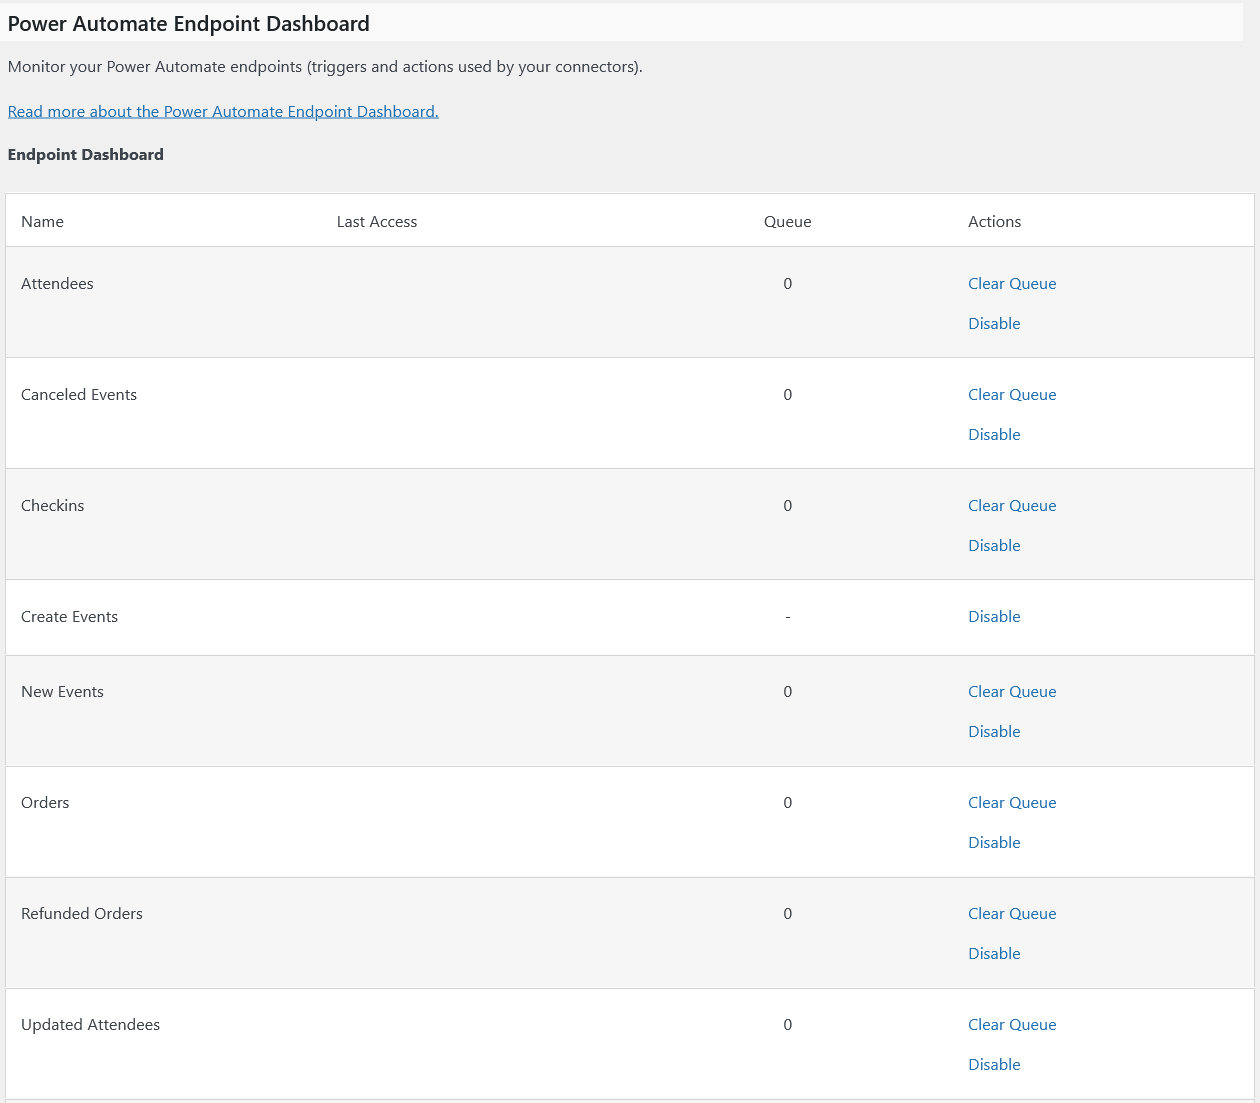
As you can see from the screenshot above, the Dashboard lists all endpoints available for The Events Calendar and Event Tickets Power Automate connectors.
Each of those endpoints matches the name of a Power Automate trigger or action for The Events Calendar and Event Tickets connectors.
Listed with each endpoint are …
- Name: endpoint name
- Last Access: name of the app last used to access that endpoint with the date and time of last access
- Queue: the number of unprocessed flows queued for the corresponding endpoint
- Actions:
- Clear Queue: wipes the queue for that endpoint clean
- Disable/Enable: lets you enable or disable a specific endpoint
- e.g. to prevent misuse/access to an endpoint that you are not using
- e.g. use as a makeshift “panic button”