
When your WordPress site feels slow, it’s often challenging to know why it’s happening.
When experiencing performance issues with plugins or themes, such as slowness when loading calendar views, saving events, or interacting with tickets, it’s important to identify what’s happening under the hood.
This article explains two effective tools to identify slow queries:
- A quick, real-time option using the Query Monitor plugin
- A deeper, long-term option using the MySQL Slow Query log
Both can help you and our support team pinpoint what’s causing performance issues.
Why the debug.log isn’t enough?
The debug.log file in WordPress only shows PHP-related errors, warnings, and notices. It doesn’t record how long a database query took to run. So if your site feels slow, it’s time to check the database performance too, and not only PHP errors.
Option 1: Query Monitor Plugin
Query Monitor is a free plugin that lets you inspect database queries during a single page load — great for quick diagnostics and identifying what’s slowing a specific request. This plugin gives you real-time information on a page-by-page basis.
What it Shows
- All database queries run on the page
- Execution time for each query
- Which plugin, theme, or core function triggered the query
- Repeated or duplicated queries
- HTTP calls, hooks, PHP errors, and more
How to Use It
- Install from Plugins > Add New → search for “Query Monitor”, and activate it
- While still logged on your admin account, visit the slow page (calendar view, single event, etc.)
- Look for the “Query Monitor” item in the admin bar
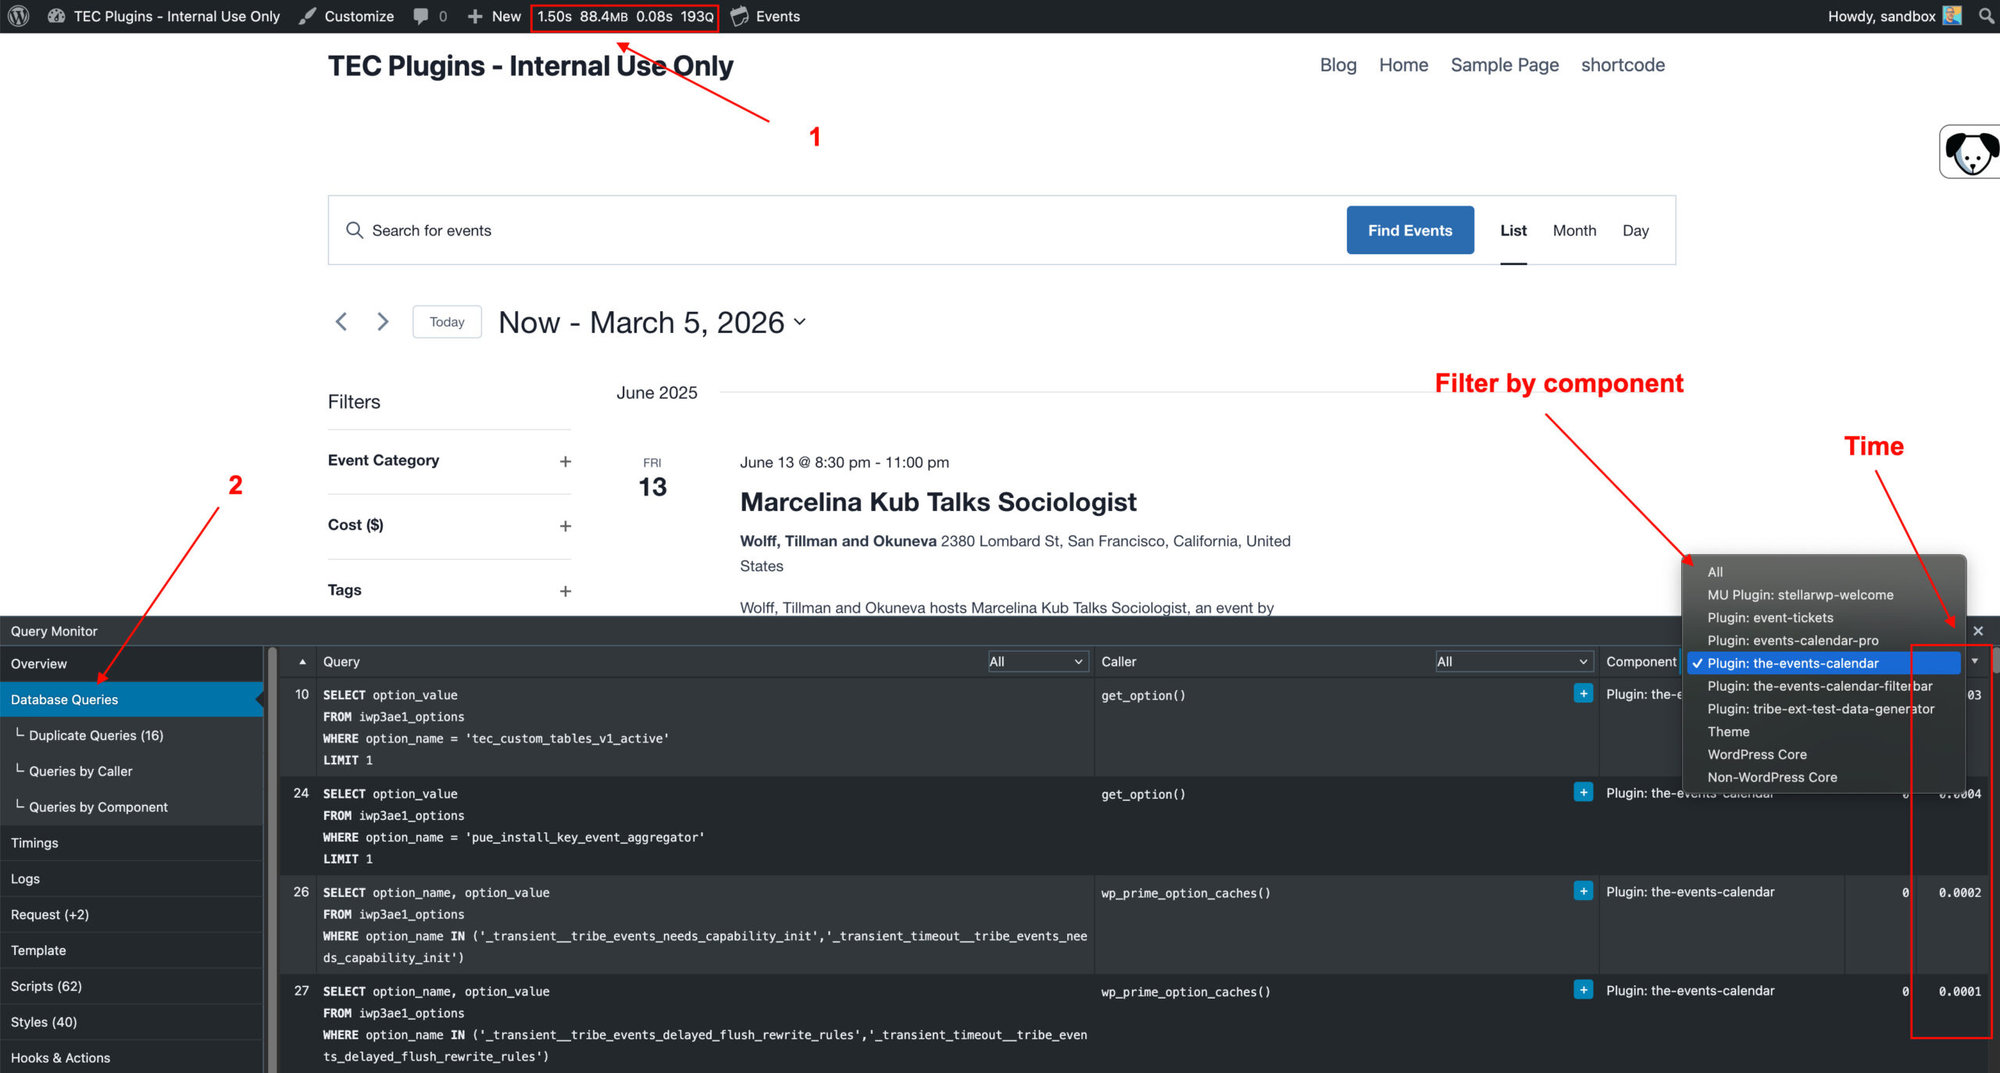
- Click the Query Monitor Button (1 in the image below) and open “Database Queries” (2 in the image below)
- Look for slow queries and note the execution time and source (you can filter by component if you want to check requests from one specific plugin)
🧠 Reminder: Query Monitor only captures queries from the current page load. If you navigate away or refresh, the data resets.
When to use Query Monitor
| Use Case | Should You Use It? |
|---|---|
| You want a quick test on a single page | ✅ Yes |
| You want to know which plugin runs a query | ✅ Yes |
| You want to investigate AJAX or admin pages | ✅ Yes |
| You need historical data or logging across time | ❌ No — use Slow Query Log |
After Testing
For performance and security, we recommend deactivating Query Monitor once you’ve completed testing, especially on production sites.
What to Share With Our Support Team
- Gather slow query data (from Query Monitor or the slow log) and share screenshots
- Let us know what page URL(s) you were testing
- Share your system information, debug log files (so we can have more data about your environment), and the name of your hosting service
Option 2: MySQL Slow Query Log
What Is a Slow Query Log?
While the Query Monitor plugin is ideal for quick checks, it doesn’t keep historical data. If you’re trying to diagnose recurring slowness or understand what’s happening over time, the best option is the MySQL slow query log. This log is a feature of a MySQL database server.
The MySQL slow query log records SQL statements that take longer than a specified time to execute. These queries might:
- Search large tables without indexes
- Join multiple tables inefficiently
- Run multiple times per request (e.g., in a loop)
Slow queries can severely impact your site’s speed, and they often originate from plugins, themes, or custom code.
WordPress itself can’t enable the MySQL slow query log. It must be configured at the server level. Here’s how to enable the log depending on your hosting environment:
Shared or Managed Hosting (Ask Your Host)
Most shared and managed WordPress hosts (like WP Engine, SiteGround, Kinsta, or Bluehost) don’t allow direct server access, but they can usually enable the slow query log for you.
What to Ask:
“Can you enable the MySQL slow query log for my site? I’d like to log queries that take longer than 1 second to execute.”
Optionally, you can include these specifications in your request:
- long_query_time = 1
- log_output = FILE
- Access to download the slow query log file
Once enabled, you should reproduce the slowness by visiting the slow page, and ask your host to send you the new log entries (or download the log if they shared how to do it).
Advanced: Enable Manually on VPS or Dedicated Hosting
If you have SSH/root access to the server, you can enable it yourself:
-- MySQL CLI:
SET GLOBAL slow_query_log = 'ON';
SET GLOBAL slow_query_log_file = '/var/log/mysql-slow.log';
SET GLOBAL long_query_time = 1;
SET GLOBAL log_queries_not_using_indexes = ON;
To make it permanent, edit your MySQL config (my.cnf or my.ini):
[mysqld]
slow_query_log = 1
slow_query_log_file = /var/log/mysql-slow.log
long_query_time = 1
log_queries_not_using_indexes = 1
⚠️ Requires administrative access and caution — improper edits may break your server.
Also, note that some dedicated hosts may already have it defaulted to enabled, so check with their support team first if they provided that.
For example, if you’re hosted on WP Engine, their system already captures slow queries and labels them as LONG QUERY in their error logs, and also provides a Slow Query Monitor on their dashboard.
What to Share With Our Support Team
- The slow log file
- Share your system information, debug log files (so we can have more data about your environment), and the name of your hosting service
Summary: Which Method Should You Use?
| Scenario | Use Query Monitor | Use Slow Query Log |
|---|---|---|
| Quick test of a single page | ✅ Yes | ❌ No |
| Long-term slowness tracking | ❌ No | ✅ Yes |
| Repeated database slowness | ❌ No | ✅ Yes |
| Finding which plugin runs a query | ✅ Yes | ✅ Yes |
| Production site performance debug | ⚠️ Short-term only | ✅ Best option |