Enabling debugging in WordPress is a great troubleshooting step to help you see what’s going on with your website. This is best done on a staging site or temporarily on a live site, as it can cause error or warning messages to show in the WordPress dashboard or on your site. Any errors or warnings will be logged in the WP_DEBUG_LOG.
There are two basic ways to enable debugging: by editing the wp-config.php file or using a debugging plugin. Using a plugin is a good option for less technical users.
Enable debugging via wp-config.php file
Locate the wp-config.php file
By default, debugging is turned off in WordPress. To enable it, you’ll first want to locate your wp-config.php file. You’ll need to access your site files through either an FTP (File Transfer Protocol) or your server’s cPanel to find this. To learn more about using FTP, check out this Knowledgebase article.
Edit the wp-config.php file
Once you’ve located the file, you can open and edit the wp-config.php file. This file contains site-specific configuration settings, such as database information and, potentially, settings added by your hosting provider. For debugging, you’ll need to find the following line of code, which is generally located towards the bottom of the file:
('WP_DEBUG',false);
Add your debugging code
Now you can overwrite the above line of code with the following code to enable debugging on your WordPress site:
// Enable WP_DEBUG mode
define( 'WP_DEBUG', true );

// Enable Debug logging to the /wp-content/debug.log file
define( 'WP_DEBUG_LOG', true );

// Disable display of errors and warnings
define( 'WP_DEBUG_DISPLAY', false );
@ini_set( 'display_errors', 0 );

// Use dev versions of core JS and CSS files (only needed if you are modifying these core files)
define( 'SCRIPT_DEBUG', true );
Be sure to add the above code before the following line:
/* That's all, stop editing! Happy blogging. */
You can now find your debug log at https://yoursitename.com/wp-content/debug.log.
Enable debugging via plugin
WP Debugging
WP Debugging is a free plugin that allows you to enable debugging and record bugs without having to edit any files. Once the plugin is installed and active, you can view your debug log by going selecting Debug Quick Look > View File from the top of your WordPress Dashboard.
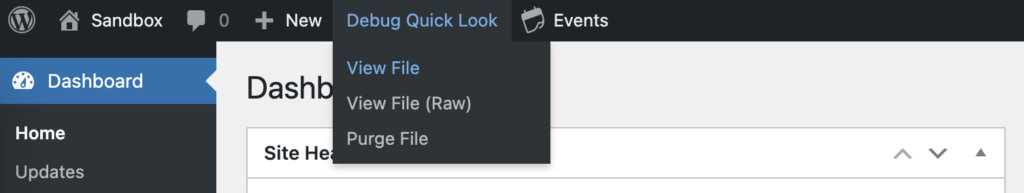
Keep in mind that the log records issues as they happen. So in order for an issue to get logged, you need to repeat the actions that led to the issue you’re trying to troubleshoot. For example, if we’ve asked you to share the debug log to troubleshoot a critical error, you’d follow these steps:
- Debug Quick Look > Purge File. That clears any past errors from the log so it’s easy for us to see the relevant information.
- On your site, go to the page where you saw the critical error.
- Go back to the Dashboard and select Debug Quick Look > View File.
- Copy all the text you see there into your support ticket.
Debug Log Manager
The Debug Log Manager is a helpful plugin designed to simplify the process of managing WordPress debug logs. Instead of manually accessing and editing the wp-config.php file or digging through your server’s file system to view logs, this plugin provides an easy-to-use interface right from your WordPress admin dashboard.
Key Features:
- Clear Logs with One Click: Easily remove old or unnecessary log entries to keep your site clean and efficient.
- View Logs in Dashboard: Access and read the contents of the
debug.logfile directly from the admin panel.
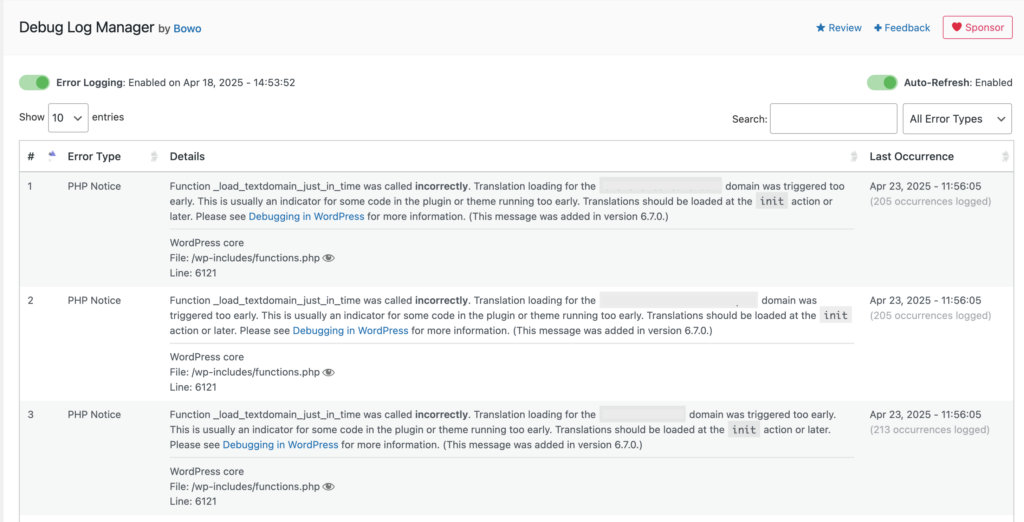
Once you’ve installed and activated the Debug Log Manager plugin, follow these steps to check for error logs:
- Navigate to
Tools > Debug Log Managerin your WordPress dashboard. - Enable both Error Logging and Auto-Refresh options to monitor logs in real time.
- Click the Clear Log button to start with a clean log file.
- In a new browser tab or page, replicate the issue you’re trying to debug (e.g., trigger the error or perform the action causing trouble).
- Return to the Debug Log Manager tab/page and check for any logged messages—particularly Fatal Errors or Warnings.
- Copy or download the log output and share it with the support team for further investigation.
Warnings and errors
Now that you’ve enabled debugging, you may notice a lot of warnings and errors that you didn’t previously know about. It’s important to note that warnings are nothing to be concerned about. Warnings are simply there to help developers during the plugin development phase. When exploring your debug log, you should look out for fatal errors, as those may be causing issues with your site. However, warnings should not pose any threat to your site, so you can simply ignore those.