admin-ajax.php is a core WordPress file located in the wp-admin directory. It acts as a central endpoint for all AJAX requests coming from your WordPress front-end or admin area. When plugins, themes, or even core WordPress features (like saving posts with autosave, updating widgets, or certain forms) need to communicate with the server without reloading the entire page, they send requests to admin-ajax.php.
Debugging issues related to these AJAX interactions often involves inspecting the requests sent to and the responses received from admin-ajax.php. This guide will walk you through how to do this using your web browser’s developer tools (available in Chrome, Firefox, Edge, Safari, etc.).
Why is admin-ajax.php Important for Troubleshooting?
- Plugin Functionality: The Events Calendar and Event Tickets heavily uses AJAX requests for user interactivity. This includes publishing an event, saving a ticket, updating a ticket, etc. where a full page refresh is not warranted.
- Error Detection: AJAX requests might return HTTP errors (e.g., 400, 500) or unexpected data, indicating server-side PHP errors, missing data, or security conflicts.
Steps to Inspect admin-ajax.php Requests and Responses
The process is largely similar across modern browsers. We’ll use Chrome’s DevTools as the primary example, but the concepts apply to others.
Step 1: Open Browser Developer Tools
Navigate to the page on your WordPress site where you suspect an AJAX issue is occurring.
Open your browser’s Developer Tools:
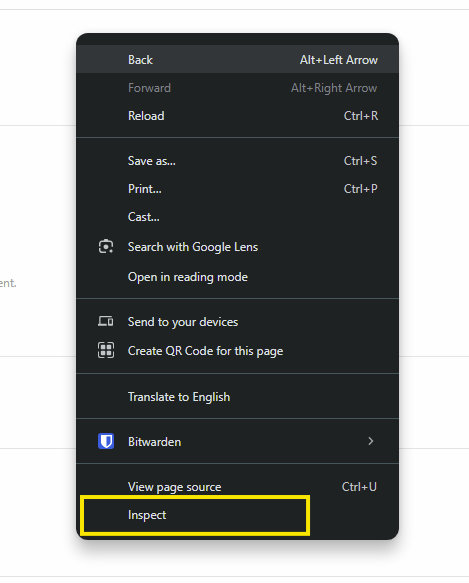
- Right-click anywhere on the page and select “Inspect” or “Inspect Element.”
- Keyboard Shortcut:
- Chrome/Firefox/Edge:
Ctrl+Shift+I(Windows/Linux) orCmd+Option+I(macOS) - Safari:
Cmd+Option+C(You might need to enable “Show Develop menu in menu bar” in Safari’s preferences first: Safari > Preferences > Advanced > “Show Develop menu in menu bar”).
- Chrome/Firefox/Edge:
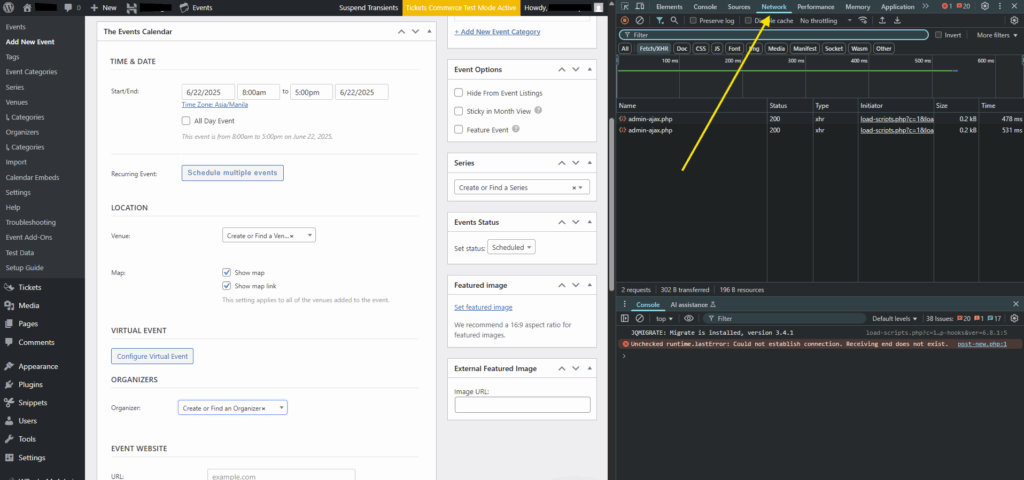
Step 2: Go to the “Network” Tab
Once the Developer Tools are open, click on the “Network” tab. This tab records all network requests made by your browser.
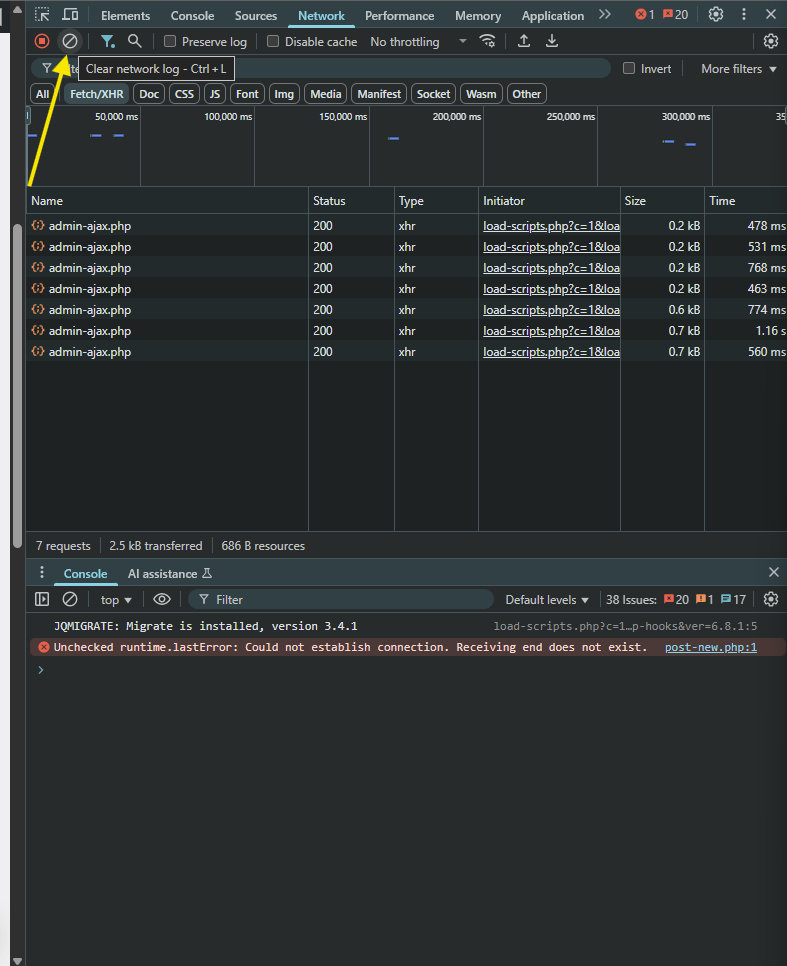
Step 3: Clear and Start Recording
- Clear Previous Requests: Click the “clear” button (usually a circle with a slash through it, or a similar icon) in the Network tab’s toolbar. This removes previous requests, making it easier to focus on the new ones.
- Ensure Recording is Active: Make sure the “record” button (usually a red circle or similar icon) is active. If it’s grey, click it to start recording network activity.
Step 4: Trigger the AJAX Action
Now, perform the action on your website (i.e., Publish an event, save a ticket, etc.) that you suspect is causing the problem and that you know relies on AJAX.
As you perform the action, you’ll see a list of requests appearing in the Network tab.
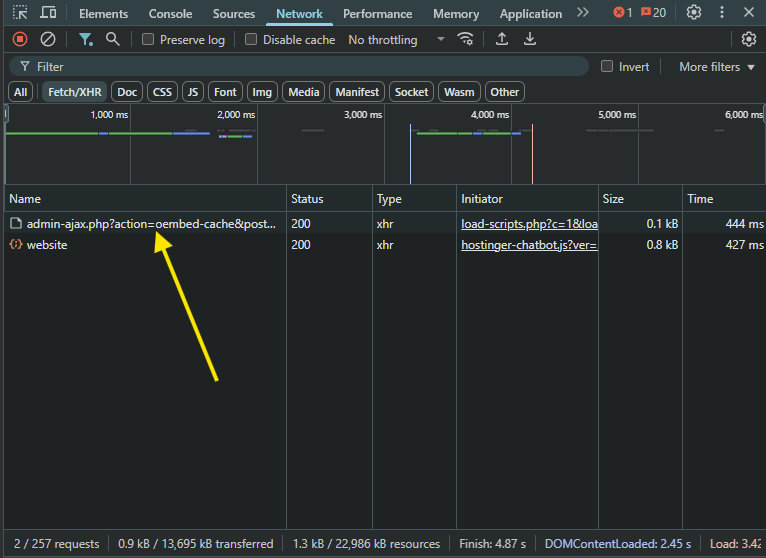
Step 5: Locate the admin-ajax.php Request
In the list of network requests, look for one where the “Name” column shows admin-ajax.php or where the “File” or “Path” column indicates wp-admin/admin-ajax.php.
You might see multiple admin-ajax.php requests. If you’re unsure which one is related to your action, filter the list:
- Search Bar: Type
admin-ajax.phpinto the filter/search bar at the top of the Network tab. - Type Filter: Click the “XHR” (or “Fetch/XHR”) filter button. AJAX requests are typically XHR (XMLHttpRequest) or Fetch requests.
Step 6: Inspect the Request and Response
Once you’ve identified the relevant admin-ajax.php request, click on it. A new panel will open on the right (or bottom) showing details about that specific request.
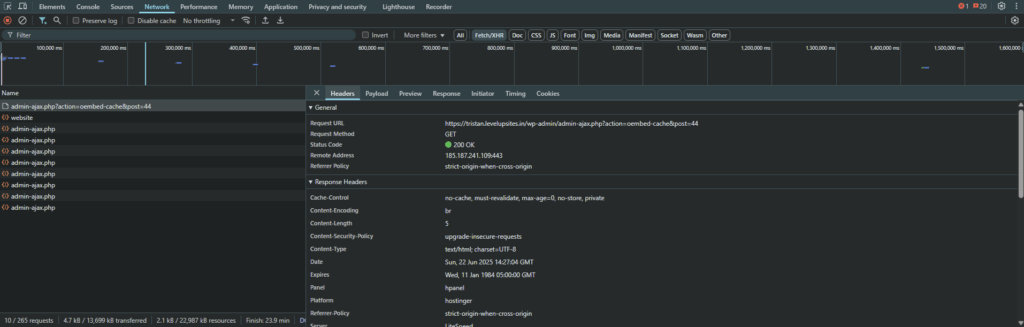
Here are the key sub-tabs to inspect:
A. Headers Tab
- General:
- Request URL: Confirm it’s
.../wp-admin/admin-ajax.php. - Request Method: Typically
POSTfor actions that send data (e.g., form submissions) orGETfor actions that retrieve data (e.g., live search). - Status Code: This is critical!
200 OK: The request was successful, and the server responded. The issue is likely with the response data or how your JavaScript handles it.400 Bad Request: The server didn’t understand the request (e.g., missing parameters).403 Forbidden: You don’t have permission to access the resource (e.g., nonce verification failed).404 Not Found: Theadmin-ajax.phpfile itself might be missing or misconfigured, or the URL is wrong. (Unlikely unless something is severely broken).500 Internal Server Error: A fatal PHP error occurred on the server while processing the request. This is very common for AJAX issues.
- Request URL: Confirm it’s
- Request Headers: Examine headers like
Content-TypeandX-Requested-With. - Response Headers: Look for
Content-Type(should often beapplication/jsonortext/html) and important headers likeSet-Cookie.
B. Payload (or “Request” / “Params”) Tab
This tab shows the data that was sent from your browser to admin-ajax.php.
actionparameter: This is the most important parameter foradmin-ajax.php. It specifies which WordPress AJAX action hook (wp_ajax_my_actionorwp_ajax_nopriv_my_action) the server should execute. Verify thisactionvalue is correct according to the plugin/theme’s documentation or code.data/ other parameters: Check that all the necessary data (e.g., form field values, item IDs, nonces) are present and correctly formatted.
C. Response (or “Preview”) Tab
This tab shows the raw data that admin-ajax.php sent back to your browser.
200 OKStatus: If you got a200 OKstatus, this is where you’ll find the server’s reply.- JSON Response: Many AJAX responses are JSON. The “Preview” tab often provides a nicely formatted, expandable view of the JSON, making it easy to see the data structure and any error messages.
- HTML Response: Some AJAX calls might return raw HTML fragments (e.g., for lazy loading content).
0or-1Response: If you see just0or-1as a response, it often indicates an AJAX call that didn’t properlydie()orwp_die()after outputting its content, or a missing/incorrectactionparameter.
- Error Messages: Look for specific error messages returned by the server, even if the HTTP status is
200 OK. Many plugins will return custom error messages within a JSON response. - For
500 Internal Server Error: If the status code was500, the “Response” tab might contain a full PHP error message (ifdisplay_errorsis enabled on your server, which it shouldn’t be on a live site, but useful for debugging on staging). This can give you the exact file and line number of the PHP error.
Conclusion
Mastering the use of your browser’s Developer Tools, especially the Network tab, is an important step that can assist in determining the root cause of an issue and is helpful information that you can provide to support.